Dashboard
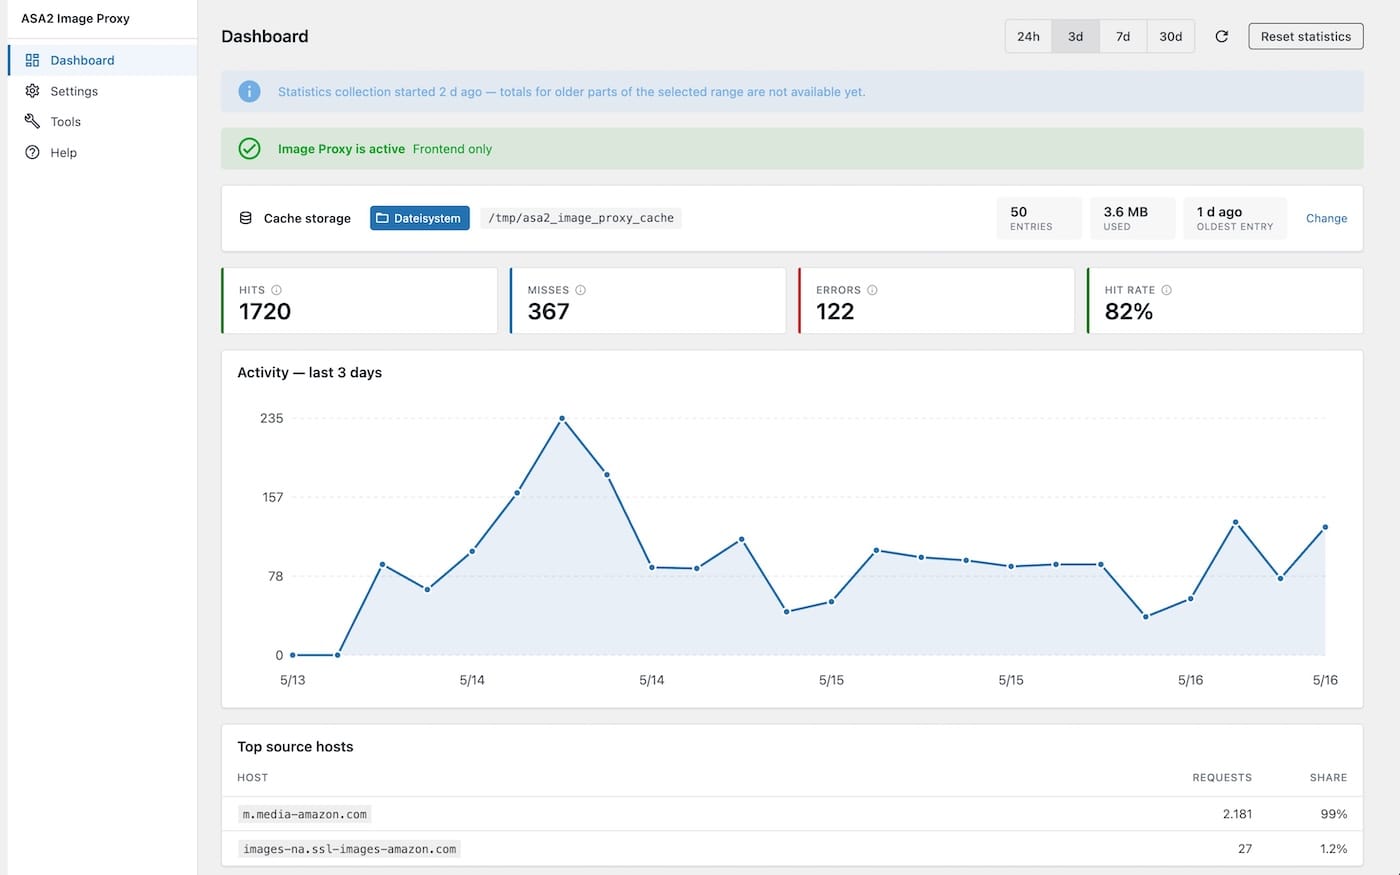
After activation, you will find a new ASA2 → Image Proxy page in your WordPress admin. The Dashboard is the landing screen and gives you a single view of activation status, cache effectiveness, traffic patterns, and recent errors.
Activation Banner
The banner at the top of the Dashboard reflects the current state of the master switch:
- Green — Image Proxy is active. The chip next to it indicates whether the proxy runs on the frontend only or also inside
/wp-admin. - Yellow (prominent) — Image Proxy is not active yet. The pipeline is installed but turned off, so external product images still load directly from their origin and expose visitor IPs. Click Go to activation setting to jump to Settings → Activation.
Stat Cards
Four cards summarise traffic for the selected date range. Each card includes a hint that explains exactly what it counts:
| Card | What it counts |
|---|---|
| Hits | Image requests served from the cache without re-fetching from the origin. Higher means lower bandwidth and faster page loads. |
| Misses | Requests where the cache had no entry — the proxy fetched the image, processed it, then stored it. Normal on first visit per image and after a purge. |
| Errors | Pipeline runs that failed (source unreachable, blocked by SSRF guard, invalid format, …). Click the card to scroll to the recent errors panel below. |
| Hit rate | hits / (hits + misses). Errors are excluded from the denominator. Above 80 % indicates the cache is effective; below 50 % suggests very diverse images or a very short cache lifetime. |
Cache Storage
The Cache storage card shows the active backend, how much data is currently stored, and the age of the oldest entry:
- Backend chip — Colour and icon reflect the active backend (folder for Filesystem, database for Redis, memory for Memcached). The chip turns yellow with a fallback warning if the configured backend is unavailable (e.g. Redis selected but
phpredisis missing). In that case the pipeline transparently falls back toNullCacheand nothing is actually cached. - Entries — Number of cached images.
- Used — Total bytes occupied by the cache.
- Oldest — Relative age of the oldest cache entry.
- Change — Quick link to Settings → Cache backend.
Memcached statistics
Memcached cannot enumerate its keys, so when the Memcached backend is active the entry count and used bytes are always reported as zero — this is a Memcached limitation, not a bug.
Activity Sparkline
A sparkline above the bottom row visualises hits, misses, and errors over the selected window. Use the date range selector in the top right to switch between presets:
| Preset | Granularity |
|---|---|
| 24h | Hourly bucket |
| 3d | Hourly bucket |
| 7d | Hourly bucket |
| 30d | Hourly bucket |
First-time activation
If the requested window is wider than the data the plugin has collected so far, an info banner appears above the cards: "Statistics collection started X ago — totals for older parts of the selected range are not available yet." This is normal right after activation.
Data aggregation
All four range presets read from the same underlying storage — there is no separate counter per range. The proxy keeps one hourly bucket per (hits, misses, errors, hosts) tuple, retained for 30 days. When you switch from 24h to 30d, the Dashboard simply asks for a wider window of the same buckets. Switching ranges therefore updates within one request, with no aggregation lag.
The minimum useful window is 24 hours because of the hourly bucket resolution. The maximum window is 30 days; older buckets are garbage-collected on every event.
This contrasts with the ASA2 Tracking add-on, which uses a daily aggregation pipeline driven by WP-Cron — worth keeping in mind if you compare numbers across both dashboards.
Top Source Hosts
Lists the origin hosts the proxy has fetched from most often in the selected window — typically Amazon CDN domains (m.media-amazon.com, images-na.ssl-images-amazon.com, …) and any other shop hosts your products use. Useful when planning the origin allowlist.
Recent Errors
Shows the most recent pipeline failures with a colour-coded short code and a plain-English description. Common codes include ip_blocked, transport_error, http_error, and unreadable — see Troubleshooting for the full list with causes and fixes.
Each row carries two extras alongside the code and description:
- Embedding page — the page that requested the failed image, derived from the visitor's HTTP
Refererheader. Click to open it in a new tab. The cell is empty when the browser sent no referer (strictReferrer-Policyon the embedding page, direct image hits, or intermediary stripping). Values are sanitised viaesc_url_raw()and capped at 500 characters. - Why? — opens the in-plugin Help tab at the matching error entry, which gives a short cause and first-fix hint and links back to the full description in Troubleshooting.
If the ASA2 Advanced Log add-on is installed and database logging is enabled, an Open full log link appears in the header of the panel and takes you to the full persistent log. If Advanced Log is installed but database logging is off, the panel shows a hint instead: "Enable database logging in ASA2 Advanced Log to see full history."
Reset Statistics
The Reset statistics button in the top right clears every collected event (hits, misses, errors, top hosts, sparkline buckets). It does not delete cached images — use Tools → Purge cache for that.